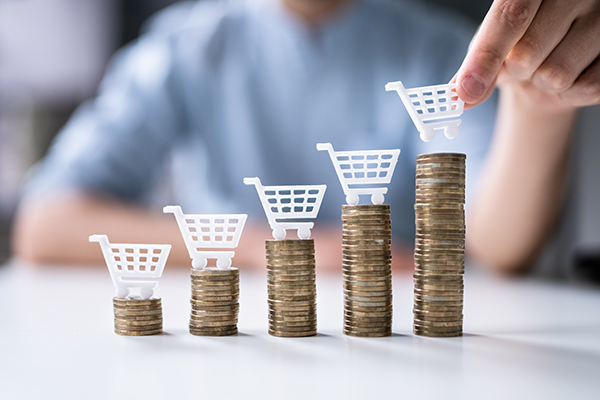
Wait, how much have groceries gone up?
07/02/2024 / By News Editors

The most startling moment in the CNN debate last week between President Joe Biden and former President Donald Trump was not from the candidates. It was from moderator Jake Tapper, who said with a straight face as if it were just the science that grocery prices were up by 20 percent since President Biden was elected.
(Article by Jeffrey A. Tucker republished from TheEpochTimes.com)
I had a hard time getting past that moment, and I suspect that many watchers did too. Just by the way, even if the current rate is lower than the past rate, that doesn’t mean that prices are falling. It means that they are rising more slowly. For some reason, maybe people, even professional journalists, don’t seem to understand that point.
Millions were watching. Intuition tells me that millions of people were stunned and thought to themselves or said out loud: no way. Truly, is there a single living soul in America who lives on a budget, watches their spending, and who believes that their grocery bills are only up by 20 percent in three years?
Well, as it turns out, Mr. Tapper could have cited the leading authority on that statistic. It’s the Bureau of Labor Statistics (BLS) as reported by the Federal Reserve. The precise number is 20.8 percent.

The trouble is that this fits with no one’s experiences. People on social media are posting receipts showing grocery prices up by anywhere between two and 10 times that rate.
In one viral video that offered receipts, a man bought 45 items (he says a full month of groceries) two years ago for $145. WalMart’s software allows him to reorder that now. He tried it just as a test. The new price: $414.
That’s an increase in two years of 185 percent! If we stretch that to three years assuming no inflation in the first, that’s an annualized increase of 61 percent. Over two years, it’s 92.5 percent.
Adding in some inflation in the first year, we can round it to 100 percent annualized, which is hyperinflation by any measure.
Commentators offered corrections that this is just one person’s experience. Maybe there was one item in there that went up vastly in price, changing the entire basket. All that is true. However, I tried looking at a few items that I bought in 2021 and found price increases of 54 percent. That’s just one item but a very normal one: lemon juice.
When all the anecdotal evidence points one way and all the official data points another way, we’ve got a problem. The distance between real experience and the official data is gigantic. And it raises the eternal problem first articulated by Chico Marx: “Who are you going to believe, me or your own eyes?”
There are alternative and more industry-based price monitors that are closer to the truth but still seem wildly underestimated as compared with real-world experience. The Grocery Price Index puts the overall three-year number at 35 percent, closer but still not in keeping with most people’s experiences.

CBS News offers an interesting grocery-price checker that shows item-by-item increases that range all over the place but generally run 30 percent to 40 percent on products you buy.

It’s the one that the Federal Reserve follows rather than the Consumer Price Index (CPI). They say it is more accurate. The data from May came in at only a 0.2 percent increase in May, which is annualized at 2.4 percent. The year-over-year data looks equally impressive. Over three years, prices overall are up by only 16 percent.

What in the world is going on here? We live in an information age. Prices are posted everywhere. It’s not like the old days when the Department of Labor had thousands of price checkers fan out to grocery stores all over the country and record prices from one month to the next. I’m not even sure if they still do that. But these days, most prices are known.
How can we end up in this strange situation?
There might be some explanations. The BLS can’t possibly keep up with shrinking package sizes even though they claim that they do. Shrinkflation has affected everything, no question. It is not just about packaging. A friend just visited Cape Cod and ordered a chocolate croissant, one he has long loved. This time, however, it was not only more expensive but it had only a small sliver of chocolate.
There is simply no way that statisticians can keep up with that.
Another factor that the BLS does not and cannot monitor is substitution. People who would once buy beef now buy chicken and pork. Or people are loading up on more rice and pasta, which are cheaper than meat and fish.
Another huge factor is substitution in the places you shop. You might have shopped at Whole Foods but now you shop at Aldi and Dollar Tree. How in the world can the CPI account for that? It can’t.
All that is true but can this fully account for the vast gap?
Consider the Personal Consumption Expenditures (PCE) data alone. How is it calculated? Here’s an explanation from AI:
“The BEA uses the same data that creates the quarterly GDP [gross domestic product] report, which measures U.S. economic output, but the PCE price index measures consumer purchases through different calculations. It converts the prices, which are still the producers’ prices, to the end price paid by the consumer. The PCE price index includes the broadest set of goods and services compared to other measures of consumer price changes. It measures changes in a basket of goods and services, but the PCE is based on data from businesses and trade organizations while the CPI is based on survey data from tens of thousands of consumers. The BEA normalizes the data via a price deflator—a ratio of the value of all goods and services produced in a particular year at current prices to that of prices that prevailed during a base year—to get the monthly PCE index: the average monthly rate of inflation (or deflation) for the U.S. economy as a whole.”
Whew, that’s some serious science right there! You need only know that it is based on the same data as the GDP, which itself is skewed because government spending and debt are included as contributors to overall wealth. Sure, people believed this in the 1930s, when national income statistics were invented, but few believe that now. Also, when you try to calculate absolutely everything, which GDP attempts to do, you increase the likelihood of inaccuracies many times over.
In other words, if GDP data isn’t trustworthy, neither is PCE.
What about the CPI? It excludes interest rate increases on everything: taxes, housing, health insurance (accurately), homeowners insurance, car insurance, government services such as public schools, shrinkflation, quality declines, substitutions due to price, or additional service fees. In particular, on the last point, a basket must compare prices in two periods. A new service and convenience fee or a simple charge for processing is not included because it is new.
People often ask: Is this all a deliberate obfuscation or is it the limits of data collection? I tend toward the latter explanation while granting that reports of a lower rate are politically advantageous. People loathe inflation. No one wants to report bad news, and that might be true of data collectors themselves.
The data collectors are sticking with systems that seemed to work in the past, but the way in which inflationary pressures have boiled through production and consumption structures this time, which is without precedent, has simply outrun the ability of old-fashioned systems of calculation to keep up.
In essence, the real world is blowing up the models. Why, then, does Wall Street adhere to them so closely? Because traders know that Fed officials follow those numbers. By watching them, they can gain some insight into the Fed’s plan. A lower inflation rate provides a template for lowering rates, and a credit-addicted financial system likes that, and, hence, stock prices rise and rise.
What does any of this have to do with reality itself? Strangely, it might not have anything to do with reality, or what people these days dismiss as anecdotal reports. Thus we are at the stage in history in which a journalist can ask the two candidates about price increases so underestimated as to have nothing to do with personal experience, and we are all expected to defer to the experts once again.
My suggestion: Dig through your receipts. The good old days live in your digital archive. Do your own calculation and see what you come up with.
Read more at: TheEpochTimes.com
Submit a correction >>
Tagged Under:
bubble, collapse, debt bomb, debt collapse, economic riot, economy, finance riot, food collapse, food inflation, food supply, grocery, grocery prices, inflation, market crash, money supply, PCE, pensions, risk, shrinkflation, Xpost
This article may contain statements that reflect the opinion of the author
RECENT NEWS & ARTICLES
COPYRIGHT © 2022 EconomicRiot.com
All content posted on this site is protected under Free Speech. EconomicRiot.com is not responsible for content written by contributing authors. The information on this site is provided for educational and entertainment purposes only. It is not intended as a substitute for professional advice of any kind. EconomicRiot.com assumes no responsibility for the use or misuse of this material. All trademarks, registered trademarks and service marks mentioned on this site are the property of their respective owners.


